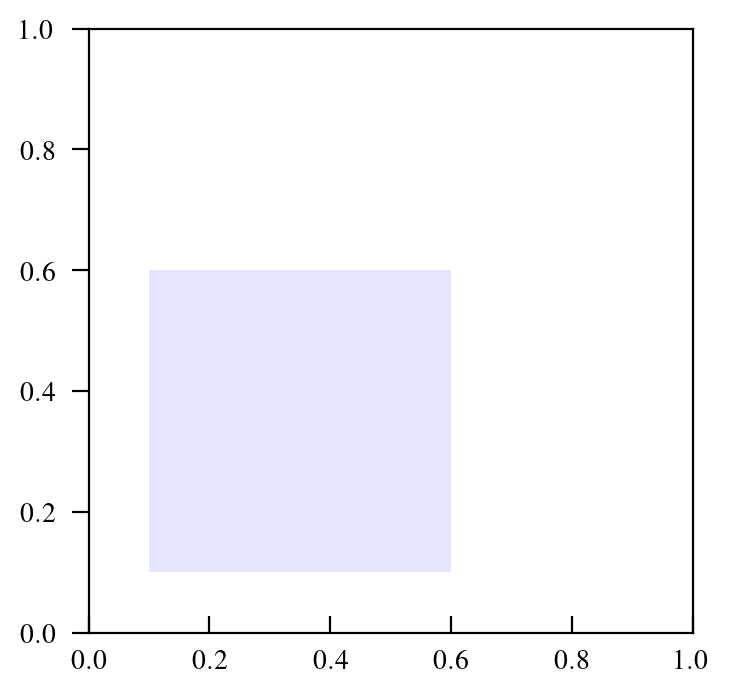
Adding a rectangle using matplotlib
import matplotlib.pyplot as plt
import matplotlib.patches as patches
plt.axes().add_patch(
    patches.Rectangle(
        (0.1, 0.1),   # (x,y)
        0.5,          # width
        0.5,          # height
        facecolor="blue",
        alpha=0.1
    )
)
plt.xlim([0,1])
plt.ylim([0,1])
plt.axes().set_aspect('equal')
plt.savefig(filename="rectangle.png",bbox_inches="tight")